Inventory management is the key to your cash flow and your store’s success. You spend more money on inventory than anything else, and while it’s the most important asset you have, it’s also the place where you can bleed money if you don’t monitor that asset very carefully.
When buyers go to shows, many make the mistake of looking at products and thinking to themselves, “I could sell that.” You could, but that’s not the only question to ask yourself. The other question is, “How much can I sell without markdowns, and where do I want my inventory to be at the end of the season (or month, or quarter, or year)?”
The success of a brick-and-mortar retailer depends on store traffic. While that seems obvious, you also have to consider what drives customers to come back. Of course, great customer service and great product are big drivers of that, but the other driver is new, fresh, exciting inventory. According to surveys, customers return to stores to see what’s new, what’s just come in, and what they haven’t seen before. As such, turning over your inventory is critical.
To do that, you must continuously evaluate and review your inventory. Most retailers do not run enough inventory reports to do that properly, and some don’t run them at all! I’ve had retailers say, “I’m here every day, I know what’s going on.” No, you only think you do. You need to run enough reports to understand the nuances of the business.
Here’s an example. If you ran a best seller report today, you’d probably know who the #1 vendor is in your store. You might also know who #2 is. But who is #5? That’s where the opportunity is sleeping. Identifying that vendor might help you find other products you’re not buying that could drive more customer visits, more sales, and fewer markdowns.
Every buyer buys merchandise with the thought that it will sell. That said, there is no such thing as a perfect buyer, and sometimes you buy something you think will be great, only for it not to perform. We always say, “The customer votes with their wallet.” If they don’t vote for it by buying it, you need to identify that quickly, mark it down (or talk to the vendor about trading it out), and use that cash to purchase inventory that they will buy.
My first recommendation is to schedule time on your calendar, weekly or every two weeks, to review your inventory. Look at what has been there for more than 60 days, and what has been there for more than 90 days. That is where your cash is hiding. If inventory has been there that long, it means customers aren’t voting for it, and you need to take steps to turn it into cash. Maybe a markdown, but I’d start with some targeted promotion – have you posted it on social media? Have you done an email blast? Have you done any clienteling? I’d use those tools first, to get rid of the goods.
The reports you need will show you the current inventory levels, what you received over the past 60 days, and the age of those goods (usually by showing the last date received). This will help you identify the inventories that need your attention.
Second, rethink how you buy. Instead of just thinking about what you can sell, think about sell-through targets. For example, I’d like to achieve 50% sell-through in 30 days, so I can at least cover the cost of the merchandise. How close can you get to that?
Third, we are strong advocates of a Vendor Scorecard. This report should show you what you received and sold over a given time period, along with the inventory you have left. This will tell you quickly whether that vendor is profitable for you. Most POS systems can create this (or customize it for you), but there is no better way to negotiate with a vendor than showing them their results. By the way, the Vendor Scorecard can also show you opportunities for growth if you see a category that sells out very quickly. Look for those, too.
Peter Drucker is famous for saying, “All good ideas devolve into work.” He was right when he said it, and he is still right today. Great cash flow comes from avoiding stockpiling inventory, and avoiding stockpiling inventory comes from having a discipline in place to review your inventory, locate the slow sellers, and turn them into cash.
How to Keep Cash Flow Healthy with Smart Inventory ManagementYou already know this feeling: sales are strong, customers are walking in, and yet somehow your bank account tells a different story. You’re not imagining it. But what most people don’t realize is that cash flow problems in the home goods industry aren’t usually revenue problems—they’re inventory problems.
Inventory is the single biggest variable in your cash flow equation, and in this industry, the stakes are higher than almost anywhere else in retail. A t-shirt brand can order 500 units for a few thousand dollars. A furniture brand placing a seasonal buy might tie up $150,000 or more in a single PO and not see that cash returned for four to six months. When that math goes sideways, it doesn’t matter how good your margins look on paper.
The good news is that smarter inventory management isn’t about running lean and hoping for the best. It’s about making deliberate, data-informed decisions that keep capital moving instead of sitting.
Here’s how to do it.
Home Goods Retailers Face a Uniquely Tough Cash Flow Challenge
Most generic advice about inventory management was written with faster-moving consumer goods in mind. Home goods and furniture operate in a fundamentally different environment.
High per-unit cost, slower velocity
A case good or upholstered sectional might retail for $1,200 to $3,000+. When that item sits on your floor or in your warehouse for 90 days, it’s not just taking up space; it’s representing real capital that isn’t working for you.
A slow-moving SKU in your world can cost tens of thousands.
Long overseas lead times create pressure to over-order
If your manufacturers are based in Southeast Asia or China (and for most home goods retailers, they are), you’re typically looking at 8 to 16 weeks from PO placement to product hitting your floor. That uncertainty pushes buyers into a defensive posture: ordering more than they think they need, just in case.
Multiply that instinct across your full SKU catalog, and you’ve got a warehouse full of capital you can’t spend.
Tariffs and supply chain volatility amplify fear-based buying
The last few years have conditioned many buyers to stock up whenever a product is available at a good price. That instinct isn’t irrational, but when it becomes the default rather than the exception, it creates chronic over-inventory and chronic cash flow strain.
Floor model investment has an invisible carrying cost
Your showroom floor is a capital asset that most retailers don’t rigorously account for. Every display unit is dollars that aren’t liquid, and many retailers hold far more floor models than are actively converting customers.
Extended wholesale payment terms slow your cash cycle further
If you’re selling to other retailers on net 30 or net 60 terms, the gap between when you paid for inventory and when you actually collect on it can stretch to six months or more. That’s a long time for capital to be in transit.
What Are the Costs of Overstocking?
Overstocking feels safe. But, in practice, it quietly drains your business.
Here are some costs to consider:
- Carrying cost: the expense of physically holding inventory. In home goods, this hits harder than most categories because you’re storing large, heavy items that require significant square footage. Whether you own your warehouse or lease it, every unsold sectional or dining set is costing you money every single month it sits there.
- Capital immobilization: This is the one that catches retailers off guard. If you have $300,000 in slow-moving inventory, that’s $300,000 that can’t be used for marketing, payroll, a new PO for a trending product, or anything else. Your business might be technically solvent and still feel completely cash-starved.
- Markdowns and depreciation: These are the other hidden taxes on overstocking. Home goods don’t spoil like food, but design trends do shift. That accent chair that was everywhere in 2022 isn’t necessarily what customers want in 2025. The longer slow-moving SKUs sit, the deeper the eventual markdown, and markdowns eat margin fast.
- Opportunity cost: the result of over-ordering the wrong things. When your cash and warehouse space are tied up in slow movers, you often can’t fulfill demand for the products that are actually selling. That’s the cruelest version of this problem, turning away customers or forcing you to watch your bestsellers go out of stock because capital is stuck in something that isn’t moving.
How to Build a Smarter Inventory System
At this point, you might be feeling overwhelmed—don’t be. Here are 4 simple steps to help you get on the best path to smart inventory management.
Know your seasonality
Home goods have distinct demand cycles that differ from those of apparel or grocery retail. The spring refresh cycle (February through April) is when consumers think about updating their living spaces after the holidays. Late summer and early fall see a surge driven by back-to-school nesting and pre-holiday décor. And post-holiday January is typically a soft period when markdowns make sense, but new orders should be conservative.
Map your PO data against these cycles by SKU category, not just overall revenue. You may find that your accent furniture turns quickly in spring but drags all summer, while your bedding and textile accessories move steadily year-round. Those patterns should drive your order timing and quantities, not assumptions or what your reps say is selling well nationally.
Set reorder points by velocity, not by feel
Most independent retailers still reorder based on instinct: “I’m running low, I should order more.” Smarter operators set formal reorder points–the inventory level at which a new order is automatically triggered–based on actual sell-through data and their known lead times.
The formula isn’t complicated:
| Reorder Point = (Average Daily Sales × Lead Time in Days) + Safety Stock |
The safety stock number is where home goods retailers need to be honest about their specific supplier reliability. If your overseas manufacturer delivers in 70 days on average but has ranged from 55 to 95 days in the past two years, your safety stock calculation needs to account for that variance.
Do this by SKU or, at a minimum, by SKU category, and revisit the numbers quarterly. A reorder point you set 18 months ago may be completely wrong today.
Use ABC Analysis to focus your attention
Not all inventory deserves equal management attention. ABC analysis is a simple but powerful framework: classify your SKUs into A (high value, high priority), B (moderate), and C (low value, high quantity). In a home goods context:
- A items – your major case goods, bedroom sets, dining room collections. These represent the most capital and the highest carrying cost and deserve the tightest inventory controls and the most accurate demand forecasting.
- C items – throw pillows, candles, small décor accessories. These items move in large quantities but entail lower capital risk. You can afford to hold slightly more safety stock here because the cost of being wrong is lower.
- B items – everything in between
The mistake many retailers make is spending equal time managing every SKU. ABC analysis tells you where your attention will have the biggest financial impact.
Manage your floor models as a capital asset
This is one of the biggest missed opportunities in home goods retail, and it’s rarely discussed in generic inventory management content.
Your showroom floor is not free. Every square foot of display space holds capital, and every floor model that isn’t actively driving sales conversations is dead weight on your balance sheet. Retailers who treat floor models as a capital asset rather than just aesthetic inventory build regular review cycles into their operations. Run quarterly audits of which floor models are actually contributing to conversions, planned markdown schedules for aging pieces, and strict limits on how many variations of a given category are represented on the floor at once.
A useful rule of thumb: if a floor model hasn’t been referenced in a customer conversation in the past 60 days, it probably doesn’t need to be there. Get it marked down, moved, or removed, and free up that capital.
Aligning Your Orders with Your Cash Flow Cycle
The cash conversion cycle is the time between when you pay for inventory and when you collect cash from selling it. This is the number that home goods retailers most need to understand and manage against.
In this industry, that cycle commonly runs anywhere from 90 to 180 days, depending on your supply chain and sales channels. If you’re placing POs with overseas manufacturers and selling through wholesale accounts on net 60 terms, you may be looking at a six-month gap between cash out and cash back in. That’s a long time to ask your business to hold its breath.
Three practical ways to compress or manage that cycle:
- Stagger your purchase orders. Instead of one large seasonal buy, place two or three smaller orders spread across the season. Yes, you may give up some volume discounts. But you also dramatically reduce the risk of a single bad bet locking up a significant chunk of your capital.
- Negotiate extended payment terms with suppliers. Net 60 or net 90 terms from your manufacturers effectively give you free short-term financing. Many suppliers will offer this to reliable, long-term customers, especially if you come to the conversation having done your homework and framing it as a partnership, not a demand.
- Separate your inventory investment from your operating capital. This is where a growing number of home goods brands are getting smarter. When your cash conversion cycle is long, and supplier terms aren’t flexible enough, external funding for furniture inventory can bridge the gap. This lets you place the orders your demand calls for without draining cash from operations, payroll, or marketing. The key is using that kind of capital strategically for specific high-confidence purchase orders, not as a band-aid for poor inventory planning.
Investing in The Right Inventory Management Technology
You don’t need an enterprise-level system to manage inventory intelligently. Most modern POS and retail management platforms, such as Cin7 and Lightspeed, offer built-in inventory analytics that most retailers underuse.
The most valuable thing you can get from any of these tools isn’t the dashboard; it’s SKU-level sell-through data integrated with your reorder workflow. If your system can automatically flag when a product hits its reorder point, alert you to SKUs that have been sitting for 60+ days, and show you sell-through velocity by category and season, you have everything you need to make smarter buying decisions.
The retailers who struggle most with inventory aren’t usually the ones who lack data. They’re the ones who have data but aren’t using it to drive actual purchasing decisions.
How Do I Know When to Stock Up?
All of the above shouldn’t be read as “always run lean.” There are moments when intentionally building inventory makes smart financial sense, and the discipline is in knowing the difference between strategic pre-positioning and reactive panic-buying.
You should consider building ahead of normal reorder points when you have confirmed purchase orders or retailer commitments that give you predictable demand, when you have reliable intelligence about an upcoming supply disruption (not rumor, but actual lead time extensions from your manufacturer), or when a genuine pricing opportunity presents itself that pencils out after you account for the full carrying cost.
The test for any opportunistic buy
Run the numbers on what it actually costs you to carry that inventory for 90 and 180 days, and make sure the savings or strategic benefit justify that cost. If it does, buy; if it doesn’t, pass.
Cash Flow Is a System, Not a Number
The retailers who manage cash flow well in this industry aren’t necessarily the ones with the highest margins or the best supplier relationships. They’re the ones who treat inventory as the dynamic, high-stakes capital decision it actually is and build systems around it rather than relying on instinct.
So, to recap:
- Start with your sell-through data
- Set actual reorder points
- Audit your floor models
- Map your cash conversion cycle
- Stack your purchase orders instead of betting it all on one big seasonal buy.
- And when demand outpaces what your current working capital can support, know that purpose-built tools exist to help you scale without sacrificing cash position.
The goal isn’t to have less inventory. It’s about having the right inventory at the right time. And always remember the importance of having the working capital to take advantage of every opportunity that comes through your door.
Visit Kickfurther to learn how inventory funding can help you protect your cash flow and manage inventory more effectively.
How to Identify and Capitalize on Your Most Profitable Product Categories
If you thought of the title of this article as a question, your first answer might be “Products that sold with the least amount of markdowns.” You could be right, but that’s only a small part of the answer. It’s not just about selling products with low markdowns. There is much more to this story.
To properly evaluate the profitability of a category, you have to consider purchases alongside sales and margins, as that will reveal the true picture. Take a look at the 2 classes in this chart:
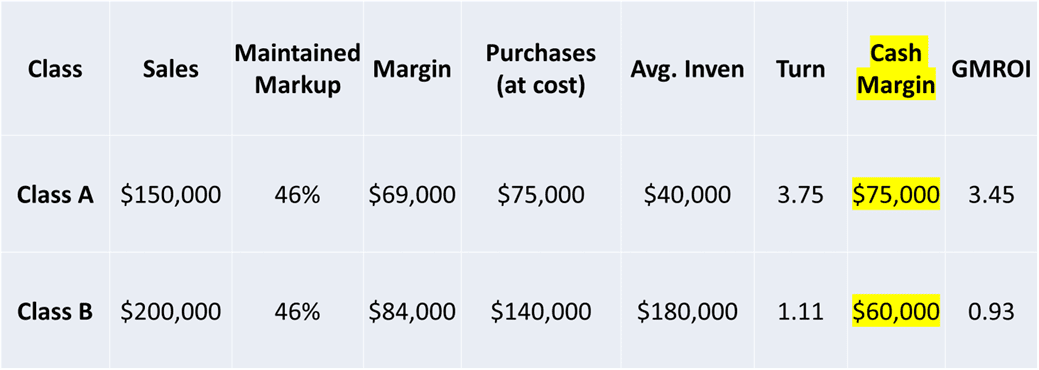
If you only looked at sales and margins, you might conclude that Class B is more profitable than Class A. But it’s not, and here’s why. Class B had more sales and generated $84,000 in margin. However, the purchases were nearly double, and the average inventory was 4.5 times higher. As such, we had a ton of money tied up in Class B, and that robbed us of profitability.
Look at the column I highlighted, labeled “Cash Margin.” Let me define that. Cash Margin is Net Sales minus Purchases at Cost. Look at Class B, and think about this in terms of your bank balance. You wrote checks to vendors for $140,000, and your customers gave you cash, credit cards, etc., for $200,000. The net effect on your bank account was $60,000. In Class A, you wrote checks to vendors for $75,000, and your customer gave you $150,000, so the net effect on your bank account was $75,000, $15,000 higher than Class B.
As such, Class A was $15,000 more profitable.
Now look at GMROI (Gross Margin, Return On Investment). This is calculated by dividing the profit margin achieved by the average inventory. GMROI can be thought of in dollars. If you have a 2.0 GMROI, it means that for every dollar you invest in inventory, you get 2.0 dollars back.
In the example above, Class A’s GMROI is way above Class B’s GMROI. Why? Because our Class B’s inventory was so much higher.
Want to improve your GMROI? There are two levers: margin and inventory. To improve your GMROI, you either increase your margin (get better deals from vendors, buy better so that you take fewer markdowns) or decrease your average inventory (buy closer to the sale, turn the inventory faster).
Obviously, this takes some practice and a proclivity for numbers. This is the “science” of retail, and these are natural laws that cannot be ignored. Once you master them, your store can achieve much, much better cash flow and success!
Inventory Turnover Rate: Why It Matters and How to Improve ItInventory is your biggest asset, but also your biggest expense. Manicuring and curating your inventory assortment is the most important job you have. It’s very easy to get distracted by other things in your business. Still, your inventory is the best place to invest your time, and in doing so, you’ll ensure better cash flow, profitability, and margins.
Sounds great, but what do you actually do to make that happen? The key is Turnover Rate, or Turn.
First, we need to establish some goals. Does your business have sales goals that you believe in? If not, you need to take some time to establish viable, achievable, believable sales goals so that you can plan out how much inventory you need. To be truly effective, those goals should be categorized by month and by location (if you have more than one store).
Once you’ve established the sales goals, the next step is to plan your inventory levels to achieve those goals without underbuying and missing sales or overbuying and tying up cash. In all my years of experience, whenever I talk to a store with good sales but bad cash flow, it’s always been true that they’re holding on to too much inventory. Sure, you can find other areas of expense that will help with cash flow, but the elephant in the room (or the warehouse) is the level of inventory that you’re holding on to.
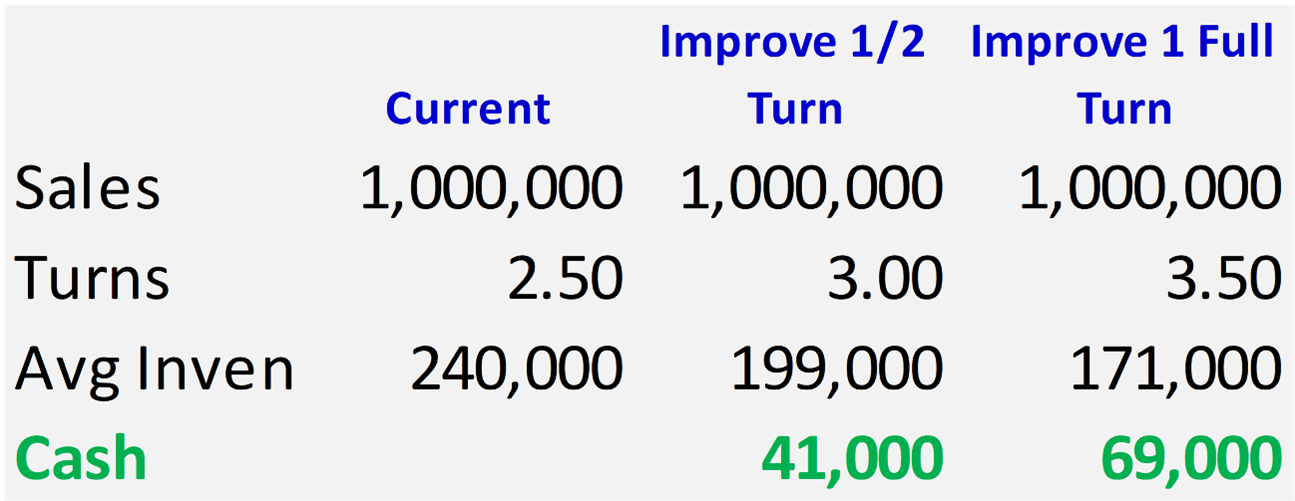
The chart above shows the potential cash flow improvements from just a slight improvement in the turn. If you have a store doing $1 million in sales per year, and you are turning your inventory at 2.50, you’re keeping an average inventory of $240,000. If you could improve your inventory turn by just .50, you would effectively lower your inventory investment to $199,000, and you’d put $41,000 in your pocket. A full turn improvement would put $69,000 in your pocket.
Think about that for a moment. Based upon your normal margins, if you wanted to get another $69,000 in gross margin, how much more would you have to sell? In the case above, given the margins, you’d have to sell at least another $150,000 or grow the business by 15%. However, by turning faster, you get the same cash margin without having to sell another piece. Let that sink in for a moment, because it’s life-changing for most retailers.
All that said, you don’t improve your turns by just saying you intend to do that. You need a strong sales forecast, as mentioned above. Next, you have to see what your historical turns have been, so you have a basis to start from. The calculation for turn is Net Sales divided by Average Inventory. I suggest you do that calculation for the last year (Turn is an annual statistic) and by category, so that you can evaluate it on a category-by-category basis.
Once you have those numbers, you can see what improving turns in each category would contribute to your cash flow. It’s worth studying each individual category; some categories could benefit from much faster turns, some will be fine as they are, and there may even be a few that are turning too fast. If a category is turning too fast, it could mean that you are out of inventory before all your customers get a chance to purchase those products, which means you are missing sales and sending your customers elsewhere to find what they’re looking for.
As you can see, it does require a delicate balance to work through this. However, I can’t think of a more important exercise. Without it, your buying becomes random, and your profitability is at risk. I encourage everyone in retail to spend time on this. The best retailers do it often.
How Smart Financing Strategies Can Drive Double-Digit Growth
Walk into most furniture or mattress stores, and you’ll see beautiful merchandising, strong sales teams, and aggressive promotional signage.
But in many cases, financing is still treated like a closing tool.
That’s the mistake.
The highest-performing retailers in today’s environment don’t use financing to “save” a sale. They use financing to expand the guests’ buying power from the moment they walk into the store. And when done correctly, this single shift can drive 15–20% year-over-year growth without increasing traffic.
Let’s break down how.
1. Financing Should Identify Buying Power, Not Rescue the Sale
Most RSAs are trained to present financing at the end:
“How would you like to pay for this? Would you like to finance that?”
By that point, the customer has already anchored their budget.
Instead, Top 100 retailers introduce financing early in the conversation:
● “Just so you know, we take Cash, Credit Card, and have multiple low monthly payment options available. Let me know if you want to fill out an application.”
● “Are you planning to pay cash or take advantage of one of our low monthly payment options?”
● “Most of our guests like to see what they’re approved for first. It often increases flexibility and lets you know what’s in the realms of possible.”
When you identify buying power up front, everything changes.
A guest who walked in thinking they were a $2,000 buyer may discover they qualify for $5,000.
Now:
● The sectional replaces the sofa.
● The adjustable base gets added.
● The protection plan becomes easy.
● Delivery upgrades become simple.
Financing doesn’t just close deals. It increases Average Order Size (AOS).
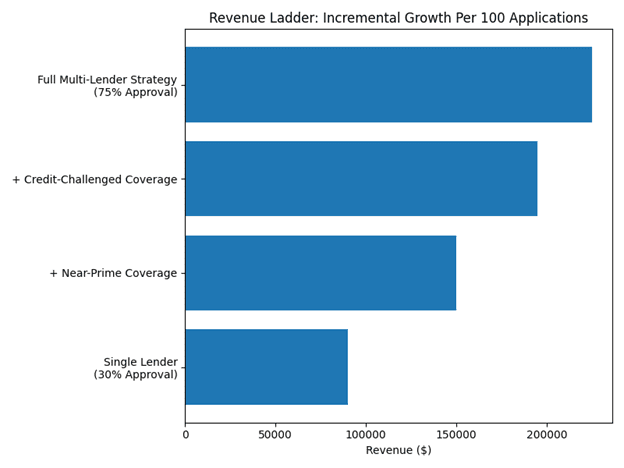
2. Multiple Financing Options = More Approvals = More Revenue
Consumers are not one-dimensional.
You have:
● Prime credit buyers
● Near-prime customers
● Credit-challenged customers
● No-credit-needed shoppers
● Customers who prefer 0% offers
● Customers who prefer long-term low payments
If you only offer one lender, you are automatically losing out on incremental revenue.
A multi-lender strategy increases:
● Approval rates
● Customer satisfaction
● Sales team confidence
● Store-wide close rates
Every additional approval isn’t just a transaction; it’s incremental revenue that would likely have walked out the door.
Of course, offering multiple options is only half the equation.
If your process requires separate applications, different portals, and manual follow-up, your team won’t use it consistently, and the customer experience suffers.
The retailers getting the best results pair a multi-lender strategy with technology that makes it simple for the RSA and seamless for the customer. (And saves you hours of overhead costs)
**Please note: This does not mean signing up with every lender in the market. Over-indexing creates noise, dilutes relationships, and can negatively impact approvals if lenders question where your loyalty or volume commitment lies. The goal is strategic balance, not volume for the sake of volume.
3. Technology Makes Multi-Lender Simple (and Profitable)
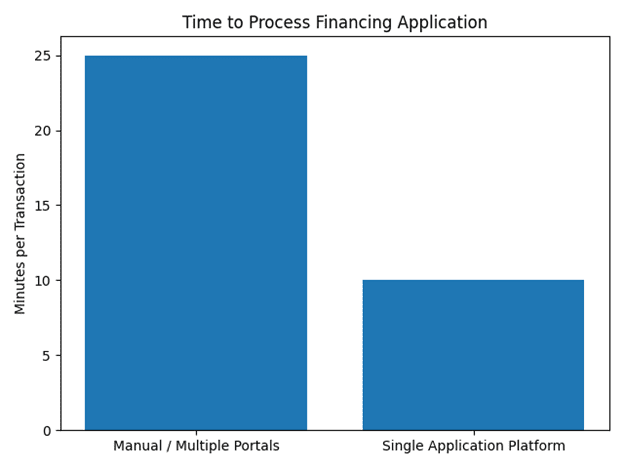
A multi-lender strategy only works if it’s easy to execute in real time. Because let’s be honest, in today’s society, people don’t want to spend all afternoon in your store, regardless of how beautiful or awesome it is. They want to get in, get out, and get on with their day.
Modern financing waterfall platforms, like FormPiper, now allow retailers to work with multiple lenders through a single application, simplifying the process for the RSA while improving customer approval outcomes.
The benefits are immediate:
- One application instead of multiple (Better customer experience)
- Less disappointment for your customers (Rejection is emotional and personal; we want to avoid this at all costs) – No More Silent Exits
- Fewer awkward “Sorry, you weren’t approved, we can try another lender” conversations (No one wants to be the bearer of bad news)
- Reduced training complexity for staff (new and existing)
- Working Smarter, not Harder, by bringing in the right technology benefits your business in multiple ways:
- More approvals.
- More revenue.
Once the process is simple and consistent, your team can stop worrying about online forms and start focusing on what really drives growth: helping customers get the right solution — not just the cheapest one.
4. The Power of the Upsell (When Done Ethically)
“Upselling” has a bad reputation.
It shouldn’t.
If financing increases buying power responsibly, then upgrading comfort, durability, and long-term satisfaction is not manipulation; it’s good customer service and a way to create the experience your customers want.
A mattress customer approved for $4,000 who buys a $1,200 set because no one showed them options didn’t “save money.” They left potential comfort and long-term satisfaction on the table. And that ultimately will reflect on your brand for years to come.
Consumer Financing makes:
- Better materials accessible (Leather instead of fabric)
- Adjustable bases attainable
- Full-room packages possible (Make your house a home)
- Accessory attachments are easier (All the bells and whistles)
When customers understand the monthly impact instead of the sticker price, the conversation changes.
You are no longer selling at the price.
You are selling comfort, sleep quality, lifestyle, and long-term value.
5. Why Merchant Discount Rates (MDR) Don’t Matter as Much as You Think
Let’s address the elephant in the room. Many retailers obsess over merchant discount rates.
“Is it 3.9% or 5.9%?”
“Is the 60-month program too expensive?”
“That lender charges more.”
Here’s the uncomfortable truth:
If financing drives higher AOS, better close rates, and incremental approvals, the revenue boost often dwarfs the cost of MDR.
Example:
- Store A averages $2,500 AOS with a minimal financing strategy
- Store B leverages financing properly and increases AOS to $3,100
Same traffic. Same team. Different strategy.
That $600 lift per ticket covers MDR differences many times over.
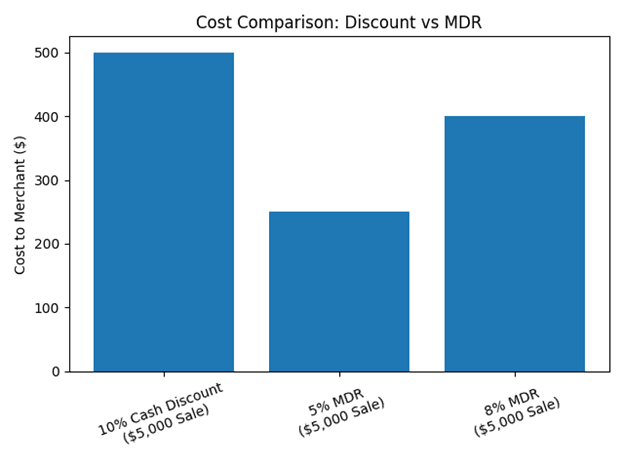
But here’s the analogy I give merchants all the time, and I hope this one hits home. If a customer wants to buy a $5,000 living room set and says:
“I’ll give you $4,500 in cash.”
Are you taking that deal?
That’s a 10% discount. You just gave up $500 to close the sale.
If it’s a $2,000 couch? You gave up $200.
And 99.99% of retailers will take that deal all day long.
So my question to all of you: Why are we stressing about paying 3%, 5%, even 8% in MDR when we’re willing to give away 10–15% in discount just to close?
Financing often eliminates the need to discount. Instead of lowering your price to make the payment fit, financing makes the payment fit without touching your margin.
You won’t go out of business because of a 1–2% variance in MDR.
You struggle when you discount unnecessarily and leave profit on the table.
The real question isn’t:
“What percentage am I paying?”
It’s:
“How much margin am I protecting?”
When you shift your mindset from protecting MDR to protecting margin, something interesting happens:
- Discounts decrease
- AOS increases
- Sales confidence improves
- Profit per guest grows
Financing doesn’t just grow revenue. When used properly, it can actually increase profitability because you’re no longer leaning on discounts to close deals. You’re leveraging buying power instead.
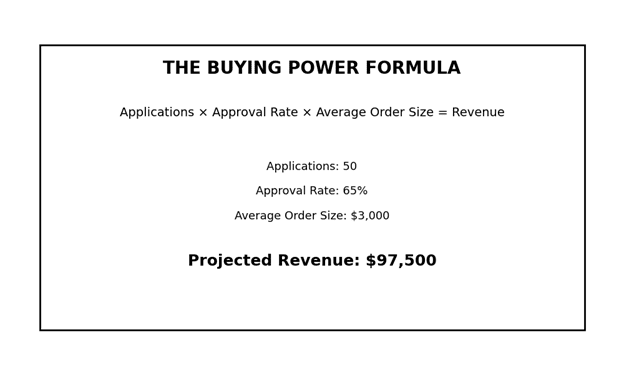
6. Stop Setting Revenue Goals. Start Setting Application Goals
Here’s where growth becomes predictable.
Let’s assume:
- Average Order Size = $2,500
- Approval Rate = 65%
- Average Approved Ticket = $3,000
Now the math becomes powerful. If every 10 applications produces 6–7 approvals, and each approval averages $3,000.
That’s roughly $18,000–$21,000 in revenue from 10 applications.
Your team doesn’t need to obsess over:
“Did we hit $80,000 this week?”
Instead, they focus on:
“How many applications did we run?”
Applications are controllable. Revenue is the result.
And most importantly, cash/credit deals will now be the gravy on top. Your RSAs are more than likely commissioned based; don’t worry, they are still taking these deals all day long.
The best retailers are doing anywhere from 60-70% of their revenue from financing. Shift your store goals from dollars to application volume, and I promise you will see less volatility in your Gross Cash Receipts and, more than likely, grow your overall cash flow.
This way, the law of numbers starts working in your favor.
- Revenue becomes more consistent.
- Forecasting becomes easier.
- Accountability improves.
- Financing penetration increases.
- Profitability follows.
7. Target Setting That Drives Growth
Track these weekly:
- Application volume per RSA/Location
- Approval rate & Close Rate
- Financing penetration percentage (Cash/Credit VS Financing %)
- Average Order Size (AOS) on financed deals vs. cash/credit deals
- Attachment rates on upgraded products
When teams see the connection between application activity and income, behavior changes. Growth stops being accidental. It becomes engineered.
Traffic is expensive. Advertising is expensive. Payroll & commission are expensive.
Buying power is not.
If you want predictable growth in a competitive furniture and mattress market, the answer may not be more customers. It may be unlocking the full potential of the ones already standing on your showroom floor.
Stop selling products. Start selling buying power.
Custom Analytics Dashboard: Turning Data into Margin
Profits don’t improve by accident. It improves when leadership can clearly see how marketing, eCommerce, product performance, and operations influence margin. Many retailers generate significant volumes of data, yet still struggle to translate it into disciplined retail profit management. Reports often live in separate systems and then in spreadsheets so teams can evaluate performance. That fragmentation does more than delay action; it creates uncertainty and quietly erodes margin over time.
A custom analytics dashboard provides structured visibility. When designed correctly, it connects ERP data, eCommerce transactions, marketing performance, and website behavior into one reporting environment. The purpose is not to increase reporting volume. The purpose is to improve clarity so teams can act decisively and protect future profits.
Retail Profit Management Starts With a Retail Analytics Dashboard
Revenue growth alone does not indicate financial strength. Retail profit management requires understanding which channels generate stronger margins, which SKUs convert efficiently, and where operational friction affects earnings. Without that clarity, teams make decisions based only on partial information. A retail analytics dashboard centralizes these insights so leadership, marketing, and sales can evaluate performance from the same dataset.
According to McKinsey & Company, organizations that extensively use customer analytics are 23% more likely to outperform competitors in customer acquisition and 19% more likely to achieve above-average profitability.
The connection between structured analytics and financial performance is measurable. Retailers that rely on fragmented reporting often delay decisions that directly influence retail profits.
A well-structured retail analytics dashboard allows teams to monitor:
- Revenue and order trends over time
- Average order value by channel
- SKU-level sales performance
- Geographic demand patterns
- Period-over-period comparisons
When these metrics are unified, teams reduce time spent validating numbers and increase time spent managing performance, shifting away from reactive reporting.
Aligning the Marketing Dashboard and eCommerce Dashboard
A marketing dashboard often tracks traffic, campaign performance, and engagement. An eCommerce dashboard typically measures transactions and conversion rates. When these reporting systems remain separate, performance conversations become misaligned. Marketing may optimize for traffic volume. Sales evaluates revenue without context around demand generation. Leadership is left reconciling two versions of performance.
Aligning the marketing dashboard with the eCommerce dashboard improves decision clarity. Website sessions can be analyzed alongside order source attribution. Organic search performance can be evaluated alongside average order value. Campaign impact can be measured against actual product revenue rather than surface engagement metrics.
This shared visibility supports both teams. Marketing can allocate spend toward channels that produce stronger order value. Sales can prioritize outreach based on category trends and regional demand shifts. When departments operate from a single retail analytics dashboard, performance discussions shift from data reconciliation to a forward-thinking strategy.
Deloitte research on data-driven organizations indicates that companies that embed analytics into operational processes are more likely to report improved efficiency and performance.
In retail environments, that alignment strengthens retail profit management by enabling every department to evaluate performance using consistent definitions and benchmarks, thereby increasing confidence in decisions.
Integration Station: ERP, Ecommerce, and Analytics in One Retail Analytics Dashboard
Ecommerce platform data alone rarely provides a complete picture of profitability. ERP systems store order history, inventory status, SKU attributes, and regional sales data. Analytics platforms capture traffic trends, engagement patterns, and search demand signals. A retail analytics dashboard becomes significantly more valuable when these systems are integrated; no longer loosely connected, but intentionally aligned.
ERP integration contributes:
- Order and revenue detail
- SKU-level performance
- Inventory visibility
- Regional sales distribution
Ecommerce integration captures:
- Transaction data
- Order source attribution
- Conversion rates
Analytics platforms provide:
- Traffic trends
- Engagement behavior
- Search query performance
When systems remain disconnected, teams manually merge reports. Gartner estimates that poor data quality costs organizations an average of $12.9 million per year.
Fragmentation increases the likelihood of inconsistencies and delayed decisions. In retail, small misinterpretations of channel performance or product demand can affect margin allocation.
Integration validates relationships between systems before decisions are made. Benchmarks remain consistent. Metrics are intentionally defined—confidence in reporting increases, strengthening retail profit management across departments.
Using an Analytics Dashboard to Improve Retail Profits
Visibility alone does not improve retail profits. Action informed by reliable data does. A retail analytics dashboard supports a structured performance cycle that connects insight to measurable outcomes.
Marketing teams can evaluate traffic quality alongside revenue contribution. If a channel generates engagement but a lower average order value, investment can be adjusted. If organic search queries indicate growing demand in specific categories, merchandising strategies can respond accordingly.
Sales teams benefit from the same clarity. SKU-level reporting highlights products that consistently drive revenue. Geographic reporting reveals regions with stronger order concentration. Order source analysis clarifies how eCommerce, wholesale, and marketplace channels contribute to overall retail profits.
A centralized retail analytics dashboard allows leadership to review:
- Revenue performance compared to prior periods
- Average order value trends
- Product category contribution
- Regional demand signals
- Channel-level revenue distribution
Retail profit management becomes proactive when these metrics are reviewed consistently. Instead of waiting for quarterly financial statements, teams monitor performance weekly. Adjustments occur earlier. Results are measured against defined benchmarks.
Over time, the retail analytics dashboard becomes embedded in the operational rhythm. Meetings focus on trends rather than data validation. Strategic discussions rely on verified metrics. Retailers improve margin through disciplined, data-informed adjustments rather than reactive analysis.
Clarity Is the Foundation of Profit
Retail environments remain competitive and margin-sensitive. Protecting retail profits requires consistent visibility across marketing, eCommerce, sales, and operations. A well-structured retail analytics dashboard unifies reporting and reduces decision friction. When ERP, eCommerce, and analytics data are connected within a single framework, leaders gain the clarity needed to manage margins intentionally.
Retailers that invest in structured reporting systems position themselves to respond to demand shifts, optimize product mix, and allocate marketing spend based on measurable performance. In margin-driven industries, clarity supports stability and long-term growth.
At Jola, we approach custom analytics dashboard builds as a collaborative partnership. We combine your team’s understanding of operations, reporting priorities, and decision-making workflows with Jola’s technical and data integration expertise. Effective reporting depends on goal alignment, accuracy, and shared context. Every dashboard begins with a comprehensive data and reporting assessment. Our focus is on delivering a custom reporting environment that prioritizes trust, usability, and meaningful insight so leadership and teams can make informed decisions grounded in reliable data.
Profitability in Uncertain Trade Policy
Why Data-Driven Sourcing Is Becoming Non-Negotiable
On April 2, 2025, President Trump announced sweeping new import tariffs that immediately reshaped cost structures across industries, including home furnishings. Companies recalculated landed costs, revisited pricing strategies, and reassessed sourcing exposure almost overnight.
Less than a year later, on February 20, 2026, the U.S. Supreme Court ruled that the administration had exceeded its authority in imposing broad tariffs under emergency powers, invalidating much of the framework and introducing yet another layer of uncertainty.
For home furnishings importers, these rapid shifts are more than political developments — they directly affect margins, inventory planning, and supplier strategy. Tariffs are no longer episodic disruptions to be absorbed and forgotten. They are ongoing variables in the profitability equation.
In this environment, waiting for stability is not a strategy. Profitability must be built to withstand volatility.
The Real Cost of Tariffs on Furniture Margins
Tariffs do not exist in isolation. When duties increase, the impact extends far beyond the percentage listed on a customs form. In home furnishings, where products are freight-intensive and often subject to long production cycles, even moderate tariff increases can compress margins in layered, indirect ways.
Higher duties increase landed costs but also affect container utilization, routing strategies, payment terms, and inventory planning. Some brands absorb part of the increase to preserve retail price positioning. Others attempt to pass costs downstream, risking slower sell-through in price-sensitive categories. Meanwhile, suppliers facing their own cost pressures may adjust minimum order quantities or renegotiate terms, tightening cash flow.
The net result is frequently several percentage points of gross margin erosion rather than a simple arithmetic increase in cost. In a sector where margins are already under pressure from freight volatility and shifting consumer demand, that erosion is significant.
Why Traditional Sourcing Models Are Under Pressure
Historically, many home furnishings companies operated with concentrated supplier bases anchored in one dominant sourcing country. Long-term relationships, annual cost negotiations, and incremental efficiency gains were sufficient when trade policy was relatively predictable. Geographic concentration was viewed as efficient and manageable.
Today, that concentration creates vulnerability. When tariffs shift abruptly, companies heavily exposed to a single region face limited flexibility. Identifying qualified alternative manufacturers takes time. Validating production capabilities, quality standards, and compliance documentation requires careful review. During that transition period, margins remain exposed.
Traditional sourcing models, built around periodic evaluation rather than continuous benchmarking, struggle to keep pace with policy-driven disruptions. In a world where trade rules can change quickly, sourcing must become more dynamic.
What Data-Driven Sourcing Really Means
Data-driven sourcing is not simply about expanding a supplier contact list. It is about building structured, ongoing visibility into the global manufacturing landscape so decisions can be made with evidence rather than urgency. In a volatile trade environment, that distinction becomes critical.
For furniture companies, this means understanding comparative cost structures across countries, tracking which factories produce similar products, and modeling total landed cost under multiple tariff scenarios before changes occur. It includes clarity on material inputs such as wood species, metal components, upholstery fabrics, and composites, as well as awareness of production clusters by region and category. When policy shifts affect one geography, companies with this level of transparency can quickly and rationally evaluate alternatives.
Platforms such as SourceReady illustrate how this visibility can be operationalized. By aggregating supplier data across dozens of countries and organizing it into structured, searchable intelligence, SourceReady enables companies to benchmark manufacturers, compare certifications, analyze historical trade data, and identify production capabilities across regions. Instead of relying solely on trade shows, personal networks, or reactive searches, brands can maintain continuous insight into alternative sourcing options.
In the current trade environment, this visibility reduces uncertainty. If tariffs increase in one country, companies can immediately assess qualified alternatives rather than beginning a months-long discovery process. If duties decline or exemptions shift, sourcing strategies can be recalibrated based on real comparative data. Diversification becomes strategic rather than reactive.
Importantly, data-driven tools do not replace supplier relationships; they strengthen them. When buyers approach negotiations equipped with market-backed benchmarks and structured cost transparency, conversations become more disciplined and collaborative. Suppliers understand that pricing discussions are grounded in data rather than speculation, which encourages stability and mutual accountability.
Speed as a Margin Advantage
One of the most overlooked drivers of profitability in a volatile trade environment is speed. Companies that already maintain visibility into alternative suppliers across multiple regions can respond to tariff changes significantly faster than those starting from scratch.
When diversification is proactive, transition timelines shorten. Cost comparisons can be modeled in advance. Production trials can be initiated before urgency escalates. This reduces the window during which tariffs directly compress margins, thereby preserving negotiating leverage with existing suppliers.
Speed does not eliminate risk, but it reduces the financial impact of disruption. In a sector defined by long lead times and complex logistics, responsiveness translates directly into margin protection.
Rethinking SKU Strategy Under Tariff Pressure
Tariffs also force a reassessment of product portfolios. Some SKUs are resilient because they carry sufficient margin to absorb cost increases. Others survive only because historical sourcing conditions were favorable.
Detailed cost breakdowns and performance data allow brands to evaluate which products remain structurally profitable under multiple tariff scenarios. In certain cases, modest design adjustments or material substitutions can preserve margin. In others, rationalization may be necessary.
Without granular sourcing intelligence, these decisions are delayed. With it, companies can proactively reshape their assortments and protect overall profitability rather than reacting after margins deteriorate.
Profitability as an Information Advantage
The broader shift underway in the home furnishings industry is conceptual. Gross margin is no longer determined solely by production cost and retail pricing strategy. The quality and accessibility of sourcing intelligence increasingly shape it.
Companies that rely exclusively on established relationships and periodic cost reviews remain exposed to policy shocks. Those investing in structured, continuous benchmarking across regions are building resilience into their margin structure.
Trade policy will likely remain dynamic for the foreseeable future. Elections, industrial initiatives, and geopolitical tensions will continue to influence cross-border commerce. Home furnishings companies cannot control these external forces. They can, however, control the sophistication of their sourcing infrastructure.
Profitability in this environment is not about predicting tariff changes perfectly. It is about ensuring that when change occurs, viable options are already visible and decisions are grounded in data. In a margin-sensitive industry, that visibility is no longer optional. It is foundational.
In uncertain trade conditions, the companies that see more clearly will move more confidently. And in today’s home furnishings market, clarity has become one of the most powerful drivers of sustained profitability.
Join HFA at High Point Market to Celebrate the 2026 Pillar Award Winners
The Home Furnishings Association invites the industry to join us at High Point Market for a special celebration honoring the 2026 HFA Pillar Award Winners.
During this gathering, HFA will formally present the 2026 Partner of the Year Award to Package.ai and the 2026 Trailblazer Award to Bill Barton, CEO, Bob’s Discount Furniture, and recognize the other exceptional leaders and organizations who earned this year’s Pillar Awards.
These awards celebrate innovation, leadership, and meaningful contributions across the home furnishings industry, from emerging talent and retail excellence to long-standing industry impact and outstanding partnership.
Date: Saturday, April 25
Time: 3:00 – 4:30 PM
Location: High Point Furniture Market in the HFA Retailer Resource Center, located in the Plaza Suites Building, Suite #1-527 at 222 Main Street HP, NC
Join us for a Happy Hour featuring curated grazing installations, decadent desserts, and beer and wine, including a signature celebratory spritz. This stylish reception offers the perfect setting to connect with peers while celebrating this year’s award recipients.
Celebrating the 2026 HFA Pillar Award Winners
-
Emerging Star: Stacie Bedford, Evans’ Heritage Home
-
Retailer of the Year (50+ Employees): Room & Board
-
Retailer of the Year (Less Than 50 Employees): Good’s Furniture & Mattress
-
Trailblazer: Bill Barton, Bob’s Discount Furniture
-
Partner of the Year: Package.ai
The HFA Pillar Awards recognize individuals and organizations who are shaping the future of home furnishings through innovation, leadership, and commitment to excellence.
Connect with peers, raise a glass, and honor this year’s Pillar Award recipients in a relaxed, creatively inspired setting.
All are welcome.
New USTR Section 301 Investigations Shaping Tariff Risks for Retailers- Public Comments to Start
Home furnishings retailers should be paying close attention to a major new trade development out of Washington.
On March 11, the Office of the U.S. Trade Representative (USTR) launched new Section 301 investigations into structural excess capacity and production in manufacturing sectors across 16 economies: China, the European Union, Singapore, Switzerland, Norway, Indonesia, Malaysia, Cambodia, Thailand, Korea, Vietnam, Taiwan, Bangladesh, Mexico, Japan, and India. One day later, USTR opened a separate set of Section 301 investigations covering 60 economies for failing to prohibit imports of goods produced with forced labor.
These actions come shortly after the Supreme Court ruled that the International Emergency Economic Powers Act (IEEPA) does not authorize the President to impose tariffs, removing that authority as a basis for broad tariff action. As a result, Section 301 is likely one of the administration’s clearest available legal pathways for pursuing new targeted trade remedies.
What’s being investigated?
The first investigation focuses on whether foreign government policies are creating or maintaining structural excess manufacturing capacity that burdens or restricts U.S. commerce. USTR says these practices can include subsidies, state-backed production, market access barriers, subsidized lending, and other policies that may encourage overproduction and persistent trade imbalances.
For home furnishings retailers, that matters because many important sourcing markets are included in the investigation, including China, Vietnam, Malaysia, Cambodia, Bangladesh, Taiwan, India, Mexico, and the European Union.
The second investigation is broader. It covers 60 major U.S. trading partners and examines whether those governments have failed to impose and effectively enforce bans on imports of goods made with forced labor. USTR has said this inquiry covers more than 99% of U.S. imports in 2024.
Key dates retailers should know
Structural Excess Capacity investigation
- Public comment docket opens: March 17, 2026.
- Deadline for written comments and hearing requests: April 15, 2026.
- Public hearings begin: May 5, 2026.
Forced Labor investigation
- Deadline for written comments and hearing requests: April 15, 2026.
- Public hearings begin: April 28, 2026.
HFA encourages retailers to comment on the USTR portal. After the comment and hearing process, USTR will determine whether the investigated acts, policies, or practices are unreasonable or discriminatory and what action, if any, should be taken, including possible tariff and non-tariff measures.
Why this matters for home furnishings retailers
While no new product-specific tariffs have been announced yet, these investigations could lay the groundwork for future trade actions targeting countries central to furniture and home furnishings supply chains.
That means retailers should begin reviewing:
- key sourcing countries and product categories,
- vendor exposure in countries under investigation,
- cost sensitivity if new tariffs are imposed,
- and any supply-chain compliance issues related to forced labor.
Even if furniture is not specifically named in the initial USTR materials, the scope of these investigations is broad enough that downstream retail sectors should not assume they will be unaffected.
HFA encourages members to comment
HFA is reviewing the USTR materials and encourages members to consider submitting public comments on the USTR portal.
Retailer input can help policymakers better understand:
- How tariffs or trade restrictions could affect pricing and consumer demand,
- How sourcing shifts affect lead times and inventory planning,
- Whether alternative supply sources are realistically available,
- and how compliance expectations should be structured for retailers and importers.
For many home furnishings businesses, this is not just a trade policy issue. It is a sourcing, pricing, margin, and planning issue.
HFA will continue monitoring these Section 301 investigations and share updates as more details become available.
Interested in speaking to legislators in person? Participate in the HFA Washington DC Fly-In, May 19-21, 2026. This strategic fly-in event is designed to elevate the voice of furniture retailers on Capitol Hill. In a series of high-impact meetings with lawmakers, policymakers, and trade officials, HFA members can make a powerful case for reform on critical issues, including tariffs, tax policy, manufacturing challenges, and regulatory overreach. For more details, contact Peter Theran, ptheran@nahfa.org.
HFA Announces High Point Market Seminar Series
HIGH POINT, N.C. (March 9, 2026) — The Home Furnishings Association (HFA) announced its High Point Market Seminar Series, delivering practical, retailer-first education at the HFA Retailer Resource Center in Plaza Suites, Showroom 1-52. This April, HFA is putting a bright spotlight on what many retailers say is the most urgent operational challenge in the business right now: logistics and shipping volatility, with a lasting final-mile experience and execution.
A Full Friday Dedicated to Supply Chain & Logistics (Don’t Miss It)
With ongoing disruption across freight markets, delivery expectations, and margin pressure, HFA is dedicating an entire day on Friday, April 24, to logistics and supply chain performance, designed to help retailers reduce damage and delays, strengthen visibility, protect the brand at the doorstep, and turn delivery into a loyalty driver. Retailers will also hear directly from logistics and compliance experts who can provide practical answers on the state of importing, the impact of tariffs, and where potential refunds may (or may not) apply. Other HFA seminars will include:
- State of the Industry: Navigating Supply Chain Chaos
- Last Impressions: Protecting Your Brand at the Customer’s Doorstep
- Cash Flow Is King: Building a Resilient Supply Chain in a Volatile Retail Market
- Turning Logistics Chaos into Customer Confidence
- Beyond the Container Rate: Using AI to Optimize Furniture Supply Chains
- From Dock to Destination: Expert Logistics Insights for Retailers
“Retailers are fighting for every point of margin, and logistics can either protect profitability or quietly erode it,” said Peter Theran, HFA CEO. “This Friday lineup is built to be immediately useful: real-world tactics, hard-earned lessons, and strategies retailers can put to work as soon as they get home.”
Additional Seminar Themes throughout the Market include: Marketing, Technology & Customer Experience
Saturday through Monday, HFA’s Market Seminar Series will also cover the following major forces reshaping home furnishings retail in 2026., HFA’s Market education also reflects the other major forces reshaping home furnishings retail in 2026:
Technology & AI in Retail Operations
Retailers can explore how AI, automation, visualization, and operational systems are changing how retailers market, sell, and support customers, featuring sessions such as Technology Trends in Home Furnishings, From Showroom to Support: How AI Assistants Are Transforming the Furniture Business, and more.
Marketing That Drives Measurable Store Traffic
These marketing sessions address what’s working now, including social strategy and creative “hooks,” connected TV (CTV), omnichannel alignment, and competitive advertising approaches. HFA has also invited a Paramount Senior VP to join an insider discussion on what’s driving measurable revenue with CTV advertising in 2026, alongside Orbit Interactive, in CTV Unfiltered: A Paramount VP Reveals What’s Driving Revenue in 2026. Additional marketing-focused sessions include Beyond Facebook: What Actually Drives Furniture Sales in 2026, Small Retailer Advertising Collective: Compete with the Market Leaders, and Do You Have the Social Hook to Win Customers.
Customer Experience & Conversion
Retailers will also find programming focused on removing friction from the buying journey, building trust, and improving close rates, including Removing Friction from the Furniture Buying Experience, The Future of Retail: Personalizing the Shopping Experience, and HFA will also spotlight true omnichannel execution with the panel The Future of Retail: Connecting Every Customer Touchpoint exploring how to align customer engagement across key channels to create a seamless experience.
Where to Find HFA at High Point Market
All seminars take place at the HFA Retailer Resource Center (Plaza Suites- Showroom 1-527), which retailers can also use as a convenient home base during Market for learning, connecting with peers, and meeting with industry partners.
About the Home Furnishings Association (HFA) Retailer Resource Center:
The HFA Retailer Resource Center provides retailers with the latest trends and strategies to help grow their businesses. Partner with leading industry vendors and experts, and connect with other furniture retailers in a community-driven showroom experience. Learn more at www.myhfa.org/event/high-point-market.
About the Home Furnishings Association:
The Home Furnishings Association (HFA), with roots dating back to 1920, is North America’s largest organization devoted specifically to the needs and interests of home furnishings retailers, with more than 1,400 members representing more than 10,000 storefronts globally. HFA provides members with programs, resources, services, and a unified voice in government relations by collaborating with home furnishings industry suppliers, vendors, affiliates, and other organizations. For more information on the HFA, visit www.myhfa.org.