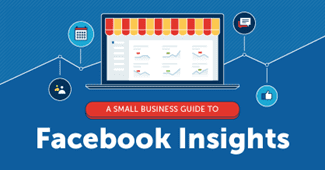
When I think of Facebook, there is one thing that comes to mind: the song “Changes” by David Bowie because they are always ch-ch-ch-chaning things up! Some of the most recent changes that Facebook made have been discontinuing the use of Job Listing ads, no longer showing ads in Instant Articles, and only being able to target 13- to 17-year-olds by gender and location, to name a few. Another big change when Facebook switched to Meta Business Suite was the Insights Reports. Facebook Insights Reports is a comprehensive guide to measuring performance on Facebook. Think of it as Facebook’s version of Google Analytics for your Facebook Business page.
With Facebook being one of the world’s most popular social media platforms, it has become an essential marketing tool for businesses of all sizes because it allows them to reach a vast audience and build relationships with customers. Measuring the performance of your Facebook content can be challenging, especially if you’re unfamiliar with the platform’s analytics tools. That’s where Facebook Insights Reports come in because they offer a wealth of data that can help you understand how your content is performing, what your audience is interested in, and how to improve your social media strategy.
Facebook Insights Reports are a set of analytics tools that allow page admins to track the performance of their content on the platform. They provide data on a wide range of metrics, such as post reach, engagement, and follower demographics.
Insights Reports are available for both Facebook Pages and Groups, and they’re updated regularly, providing admins with real-time data on how their content is performing. With Insights Reports, admins can better understand their audience and adjust their content strategy to serve their followers’ interests better.
There are two ways to access Facebook Insights Reports:
Option 1: To access Facebook Insights Reports, you must be a Page or Group admin. Once logged into your Facebook account, go to your Page or Group and click on the “Insights” tab in the top menu.
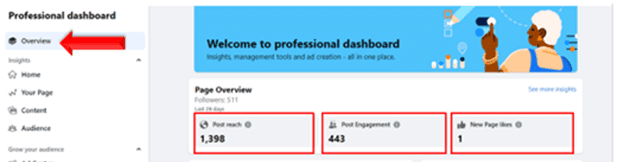
Then you will go to “Professional Dashboard”. That dashboard will default to this brief overview section, where you will see Post Reach, Post Engagement, New Page Likes, and Recent Content. These metrics are displayed for the past 28 days.
From there, you’ll be able to see a range of data on your Page or Group’s performance, including:
Reach– The number of people who saw your content at least once. People reached differs from impressions, which may include multiple views of your content by the same people. This metric is estimated.
Post Engagement– The number of reactions, comments, shares, and clicks on your post.
New Page Likes– The number of new likes the page has received.
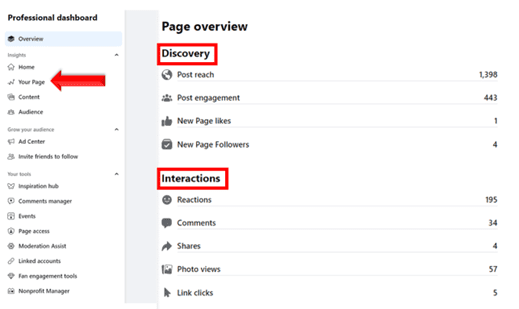
To dive in a little deeper, go to the Insights navigation toolbar and click “Your Page”. That will give you an overview of Post Reach, Post Engagement, New Page Likes, and New Page Followers. It will also show how people interact with your posts via Reactions, Comments, Shares, Photo Views, and Link Clicks.
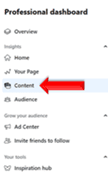
If you click on “Content” in the Insights navigation toolbar, it will show you the content you have posted chronologically, and it will break out the Post Reach and Post Engagement for each of those posts:
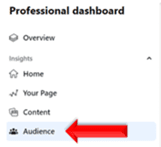
If you click on “Audience”, that will show you the people interacting with your page in the past 28 days by gender, age, and location:
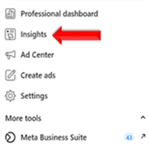
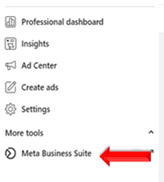
Option 2– This is where you will find more expanded insights. You still must go to the Facebook page and be logged in as an admin, and then you will click on “More Tools” and go to “Meta Business Suite”. If you don’t see “Meta Business Suite” as an option, you have not set up the Facebook Business Page in Facebook Business Manager. If you need instructions on how to add a Facebook Business Page to Facebook Business Manager, click here.
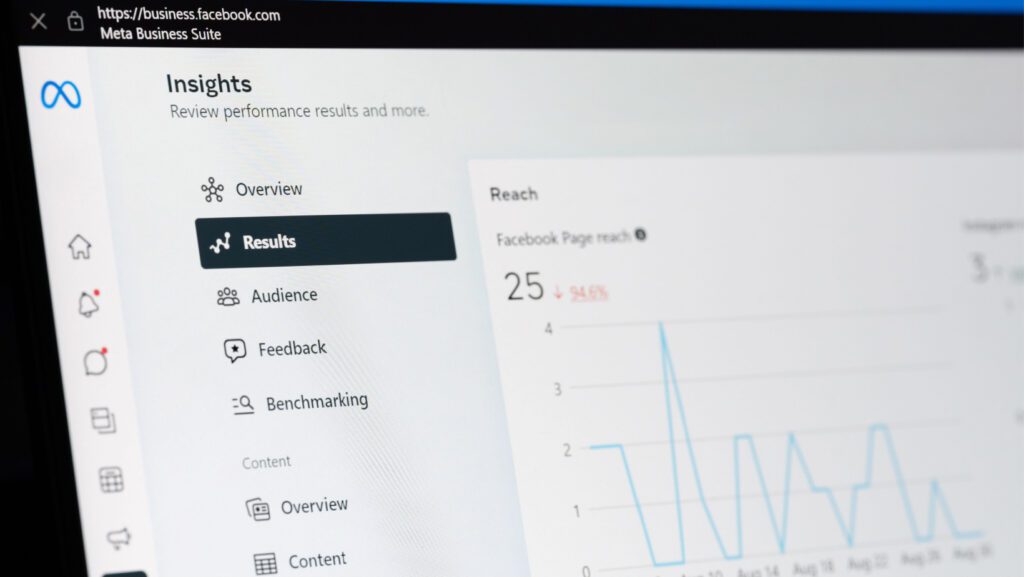
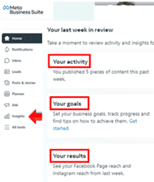
Once you click on “Meta Business Suite”, then you will click on “Insights”, and you will see a pop-up window that gives you your last week in review of activity, goals, and results when you click on “View All Insights”, you can look deeper:
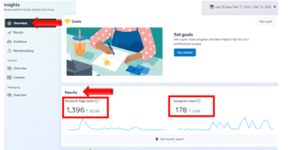
Next, you will see a dashboard that defaults to an overview page, and it will show data from the last 28 days, but you can change the date range:
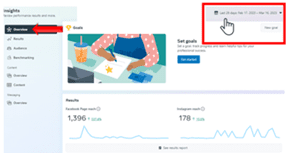
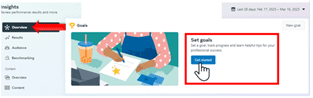
A new section in this dashboard is “Set Goals”. This is a feature where you can set goals to grow your reach or your followers on your Facebook and Instagram pages over time. When you click “Get Started” under Set Goals, it will go through options for growing your reach or followers, and you can monitor that progress.
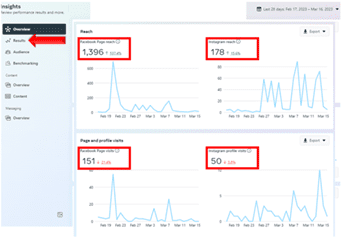
Further down, it will show results for Facebook Page Reach, Instagram Reach, and some of the top Content during the period listed.
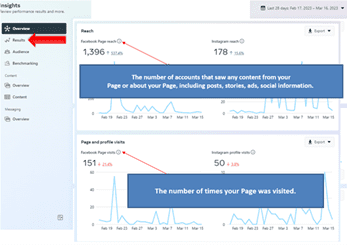
Page Reach– The number of people who saw any content from your Page of about your Page, including posts, stories, ads, social information from people who interact with your Page, and more.
Under the “Results” section, you can view Page Reach, Page Visits, and New likes:
If at any point you’re not sure what metric that you are looking at consists of, the “i” icon explains what each section is that you are viewing:
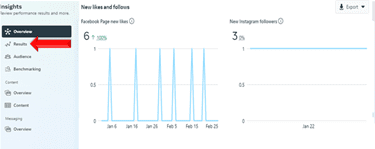
If you continue to scroll through the “Results” tab, it’s going to show any new likes and followers on Facebook and Instagram during the period selected:
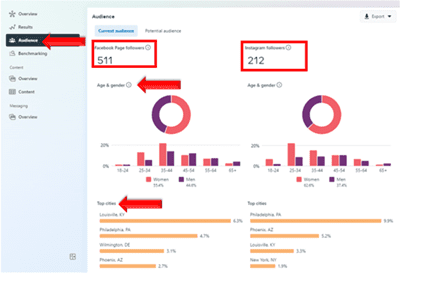
Under “Audience”, you get a breakdown of the ages and gender of Facebook and Instagram Page Followers separately, and below that are the top cities of those followers:
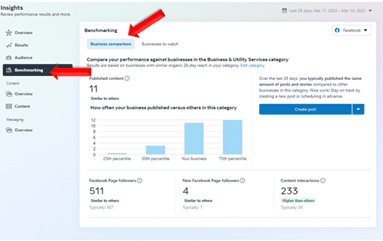
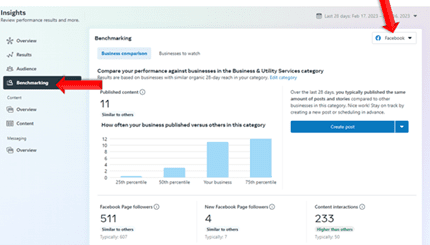
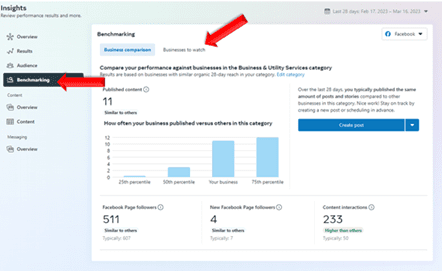
Further along in Insights is “Benchmarking”. Here, you can see how your page compares to similar businesses in your same service category and what percentile you rank on Facebook. On the dropdown, you can also view the same for Instagram. It also compares followers, new page followers, and interactions. On “Businesses to Watch,” you can add specific business pages you want to compare to. These reports are only available for every 28 days:
This report will automatically default to Facebook. To switch to Instagram, you will toggle it here:
This will also show how your Facebook Page Followers, New Facebook Followers, and Content Interactions compared to other businesses in your service category:
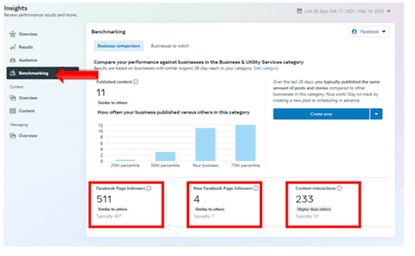
Another feature in this “Benchmarking” report is “Business to Watch,” where you can add your top competitors and compare the same information against people that you are competing with for the same type of customer:
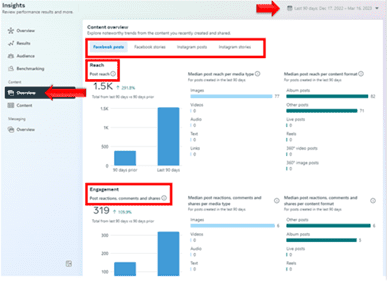
Under the Content navigation bar, “Overview” will show trends and recently shared and created content, which can be viewed only in the last 90 days. Here, you will see Facebook Posts, Facebook Stories, Instagram Posts, and Instagram Stories, and shows by Reach and Engagement:
Under the “Content” section, it’s going to break out all the top content, and it’s going to share what type of content it was, the Reach, Likes and Reactions, and Comments during the date range that is specified you can change that date range:
You also have the option to look at Ads AND Posts, just ads, or just posts.
Some of the key takeaways that will help you maximize your social media presence are:
- Audience demographics– By analyzing follower demographics such as age, gender, and location, you can tailor your content to suit your audience’s interests and preferences better
- Post-performance- This information can help you identify which types of posts are resonating with your audience and adjust your content strategy accordingly.
- Best days and times to post- Insights Reports can help you determine when your followers are most active on the platform, allowing you to schedule your posts for optimal engagement
- Reach by audience- This can help you refine your targeting strategy and ensure your content is reaching the right people
- Engagement metrics- By analyzing engagement metrics such as likes, comments, shares, and clicks, you can gain insights into how your audience is interacting with certain posts and/or ads
Before diving into Insights, it’s important to establish clear goals for your social media presence/campaign. Whether you want to increase engagement, drive website traffic, or generate leads, having a clear objective will help you make sense of the data, and you can use that to change your strategy if needed. Once you’ve established your goals, regularly monitor your performance on Facebook using these Insights Reports. Then, look for trends in your data and identify which content types drive the most engagement. From there, refine your social media strategy based on what you see to meet your goals better. For example, if you notice that videos drive the most engagement, focus on creating more content. Lastly, don’t be afraid to experiment with different types of content and posting schedules. This is where you can once again rely on the Insights Reports to help measure the impact of these ch-ch-ch- changes to have the most effective social media presence and/or ad campaign.